Demand and Supply
Matthew Williams
||9 min readCeteris ParibusCSEC EconomicsDemandDeterminantsMarket EquilibriumPaper 01Paper 02Section 3Supply
The concept of a market, laws of demand and supply, demand and supply schedules, non-price determinants, ceteris paribus, market equilibrium and disequilibrium, and the effects of shifts in demand and supply.
Markets exist wherever buyers and sellers interact to exchange goods and services. The forces of demand and supply determine prices and quantities in those markets. Mastering this topic is essential — it underpins almost every other area of microeconomics.
What is a Market?
A market is any situation in which buyers and sellers communicate for the purpose of exchanging goods and services. A market does not need a physical location. Online platforms, stock exchanges, and agricultural commodity trades are all markets. Every market has four elements: buyers, sellers, the goods or services being exchanged, and a price.
Demand
Demand is the quantity of a good or service that consumers are willing and able to purchase at various prices over a given time period, holding all other factors constant.
Note the phrase "willing and able" — a want backed by purchasing power constitutes effective demand. Wishing to buy something without having money to pay for it is not demand in the economic sense.
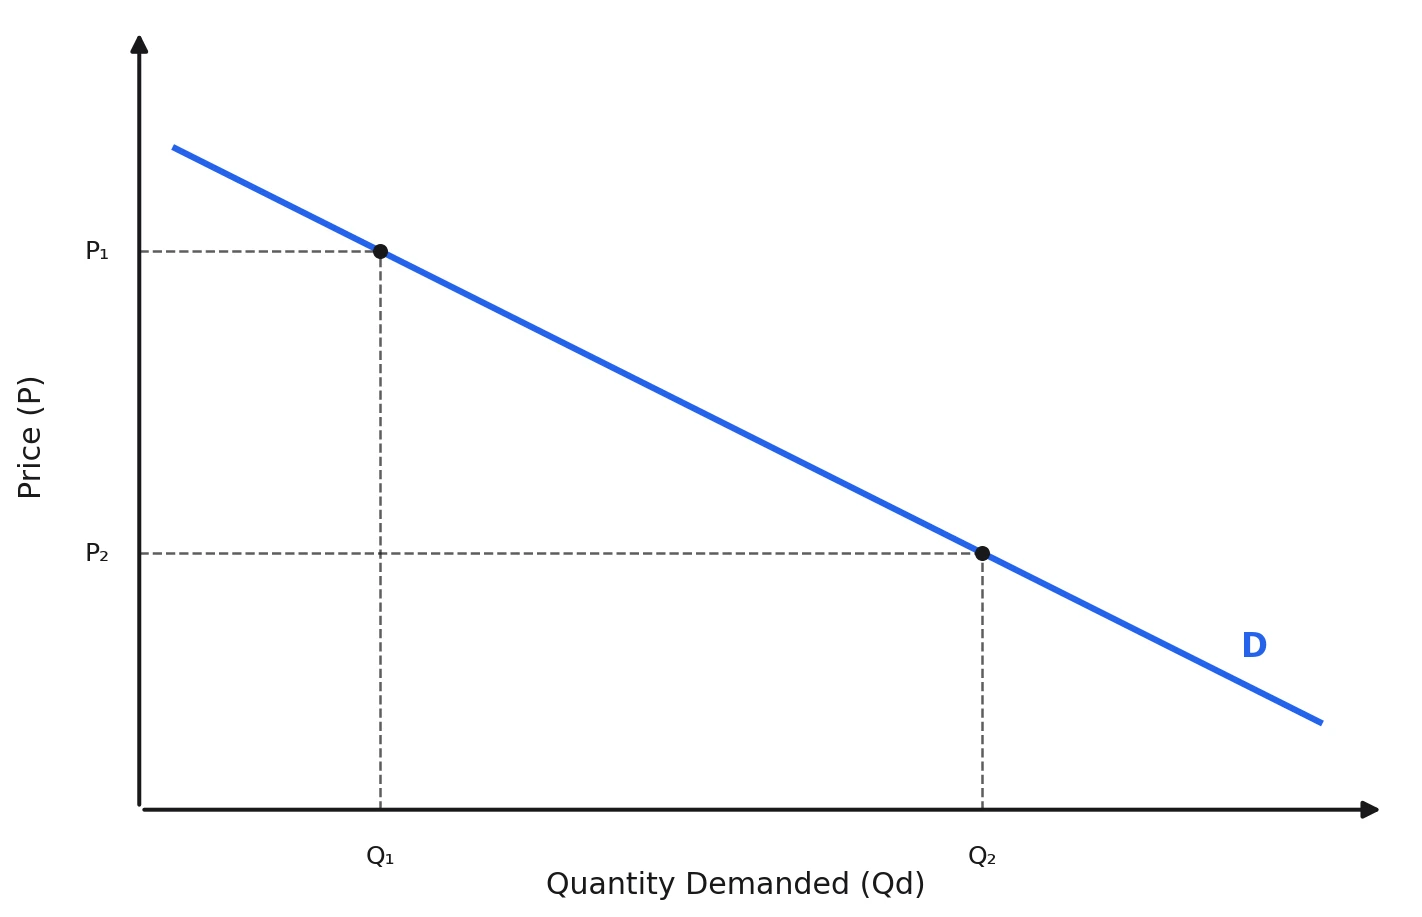
The Law of Demand
As the price of a good rises, the quantity demanded falls; as the price falls, the quantity demanded rises — all other things being equal.
This inverse relationship arises because: when a good becomes more expensive, buyers switch to cheaper substitutes (substitution effect) and their real purchasing power falls even if their money income stays the same (income effect).
The Demand Schedule and Curve
A demand schedule is a table showing quantity demanded at each price level. The corresponding demand curve slopes downward from left to right, reflecting the inverse price-quantity relationship.
Non-Price Determinants of Demand
Price determines where you are on the demand curve (a movement along the curve). Any other factor that changes demand shifts the entire curve left or right:
| Determinant | Effect on demand if it increases |
|---|---|
| Consumer income (for normal goods) | Demand rises — curve shifts right |
| Consumer income (for inferior goods) | Demand falls — curve shifts left |
| Price of substitutes (e.g. rival brands) | Demand rises — consumers switch to this good |
| Price of complements (e.g. cars and petrol) | Demand falls — the good is used alongside a now-pricier complement |
| Tastes and preferences | Demand rises if the good becomes more fashionable |
| Population size | Demand rises with a larger population |
| Consumer expectations (future price rise) | Demand rises now as consumers buy before the expected rise |
Remember
A normal good is one whose demand rises when income rises. An inferior good is one whose demand falls when income rises — cheaper options are abandoned for better ones. Examples of inferior goods: cheap margarine (replaced by butter), bus rides (replaced by cars).
Supply
Supply is the quantity of a good or service that producers are willing and able to offer for sale at various prices over a given time period, holding all other factors constant.
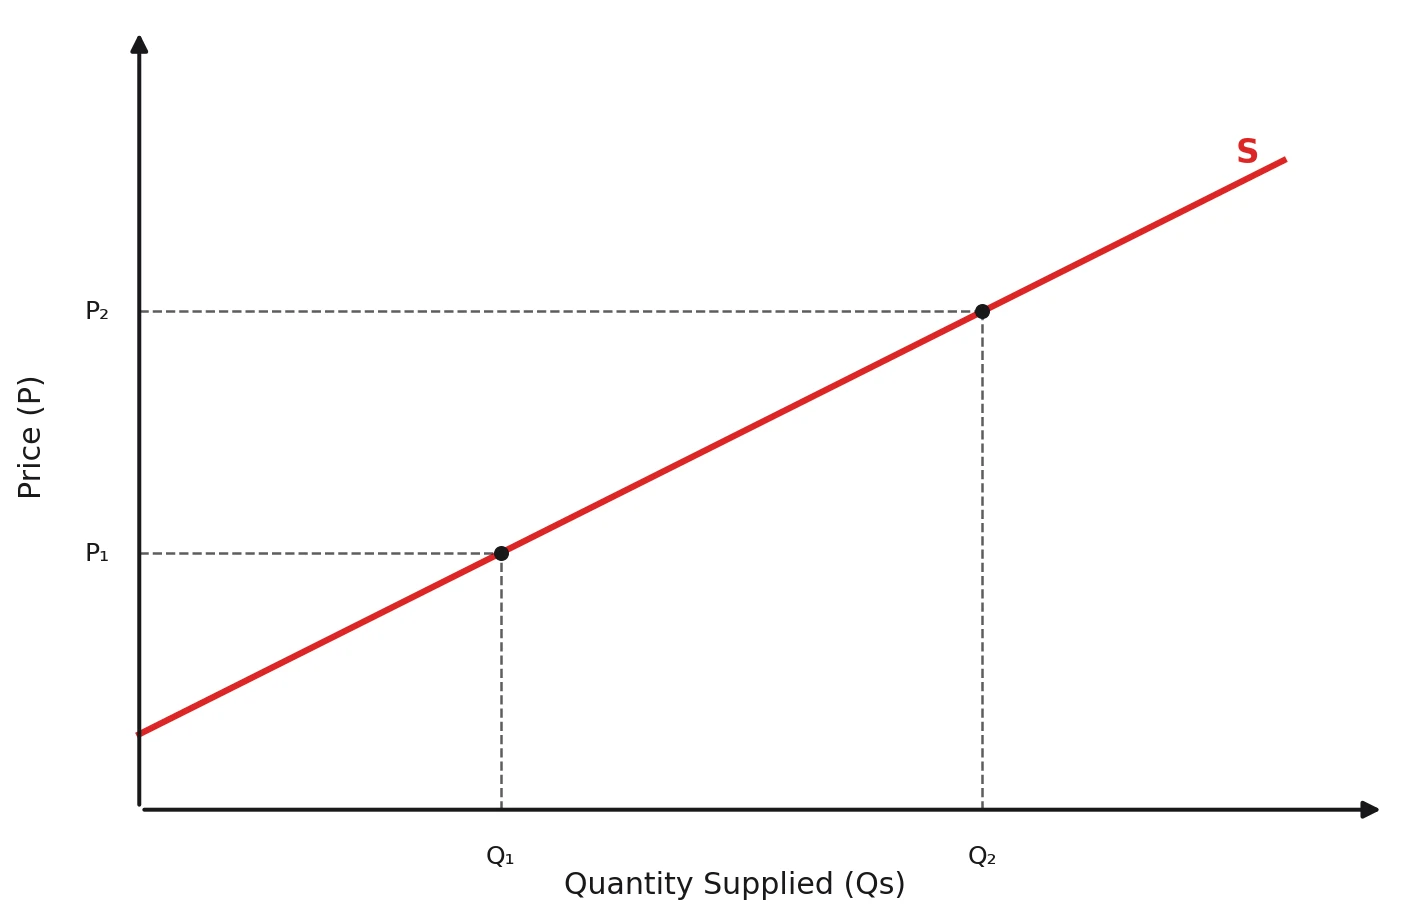
The Law of Supply
As the price of a good rises, the quantity supplied rises; as the price falls, the quantity supplied falls — all other things being equal.
This direct relationship arises because higher prices make production more profitable, incentivising existing firms to produce more and attracting new firms into the market.
The Supply Schedule and Curve
A supply schedule is a table showing quantity supplied at each price. The supply curve slopes upward from left to right.
Non-Price Determinants of Supply
| Determinant | Effect on supply if it increases |
|---|---|
| Cost of production (wages, raw materials) | Supply falls — costs rise, making production less profitable |
| Technology | Supply rises — more efficient production from same inputs |
| Number of firms in the industry | Supply rises |
| Taxes on production | Supply falls — effectively raises costs |
| Subsidies to producers | Supply rises — effectively reduces costs |
| Weather (for agricultural goods) | Good weather increases supply; bad weather reduces it |
| Producers consuming their own good | Supply to market falls |
| Price of related goods in production | If a related good becomes more profitable, supply of this good falls |
Ceteris Paribus
Ceteris paribus is Latin for "all other things being equal." It is the assumption economists make when analysing the effect of one variable at a time. When we say "an increase in price reduces quantity demanded," we assume all other factors (income, tastes, prices of substitutes) remain unchanged.
Without this assumption, it would be impossible to isolate the effect of price on demand — changes in two or more factors simultaneously would make results impossible to interpret.
Market Equilibrium
Market equilibrium occurs when the quantity demanded equals the quantity supplied at the prevailing price. There is no tendency for price to change because all buyers who want to buy at that price can find a seller, and all sellers who want to sell at that price can find a buyer.
The equilibrium price is the price at which Qd = Qs. The equilibrium quantity is the amount bought and sold at that price.
On a diagram, equilibrium is the point where the demand curve and supply curve intersect.
Disequilibrium: Surplus and Shortage
Surplus (excess supply): When the market price is set above equilibrium, Qs exceeds Qd. Unsold stock builds up. Sellers respond by cutting prices, pushing the market back toward equilibrium.
Shortage (excess demand): When the market price is set below equilibrium, Qd exceeds Qs. Consumers compete for the limited supply. This pressure drives prices upward toward equilibrium.
| Situation | Price relative to equilibrium | Qs vs Qd | Market response |
|---|---|---|---|
| Surplus | Above equilibrium | Qs > Qd | Price falls toward equilibrium |
| Shortage | Below equilibrium | Qd > Qs | Price rises toward equilibrium |
Shifts vs Movements Along the Curve
This distinction is crucial and commonly tested.
A movement along the curve happens when the good's own price changes. For demand, price rises → move up the curve; price falls → move down. Same logic for supply.
A shift of the curve happens when any non-price determinant changes:
- Demand shifts right if income rises (for a normal good), population grows, or preferences strengthen.
- Demand shifts left if a complement becomes more expensive or tastes shift away.
- Supply shifts right if technology improves, production costs fall, or more firms enter.
- Supply shifts left if production costs rise or taxes are imposed.
Effects of Shifts on Equilibrium
When demand or supply shifts, the equilibrium price and quantity both change. The direction depends on which curve shifts and which way.
| Change | Effect on equilibrium price | Effect on equilibrium quantity |
|---|---|---|
| Demand rises (curve shifts right) | Price rises | Quantity rises |
| Demand falls (curve shifts left) | Price falls | Quantity falls |
| Supply rises (curve shifts right) | Price falls | Quantity rises |
| Supply falls (curve shifts left) | Price rises | Quantity falls |
Example
A drought reduces the coffee harvest in Jamaica. Supply of coffee shifts left. At the original price, there is now a shortage. The shortage causes the price to rise. As price rises, quantity demanded falls (movement up the demand curve) and quantity supplied by remaining producers rises (movement up the new supply curve). A new equilibrium is reached at a higher price and lower quantity.
Exam Tip
When a Paper 02 question asks you to use a diagram to explain a change in market conditions, always: (1) draw the original curves and label the equilibrium, (2) show the shift with an arrow, (3) mark the new equilibrium, and (4) state what happened to price and quantity in your written explanation. Arrows on the diagram earn marks only if your explanation matches them.